We all know that bad hires are expensive. In fact, that’s become a cliché, and clichés don’t motivate or impress. So in this blog, let’s look at what a bad hire really costs, in actual dollars. Let’s take a look at a sales rep. The costs of a bad hire – and the savings (yes, there are some) – include:
- Less revenue
- Transition costs – i.e., severance payments, search fees, new-hire draw payments yet again
- Somewhat offset by less commission expense, and no salary expense during the search period
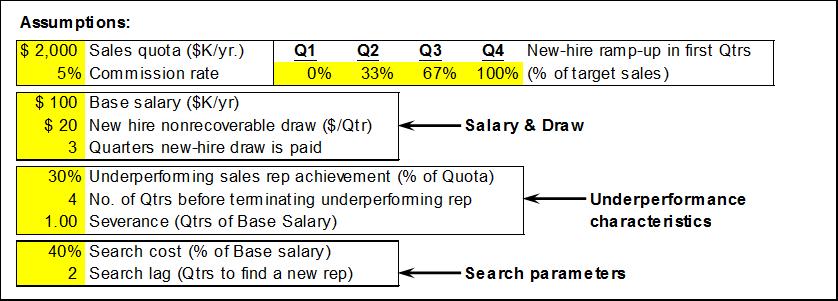
All of these assumptions can be quantified. For example:

Given these assumptions, here’s what the revenue and expense stream looks like for the three years starting on the hire date of a good hire – that is, a rep consistently performing at 100% of quota:

After an initial start-up phase, this rep becomes a steady producer.
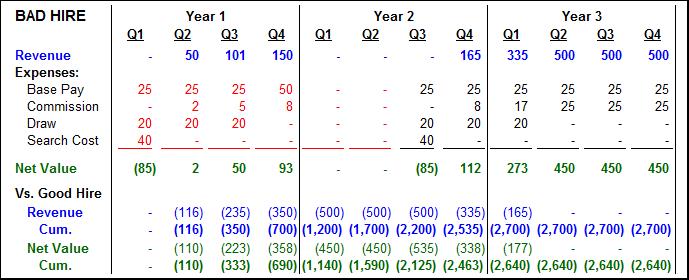
Now let’s look at what a bad hire costs – one performing consistently at only 30% of quota. As shown in the assumptions above, let’s assume that this hire gets terminated after four quarters, and that it takes another two quarters to find a replacement. Note that at the bottom we present a comparison of revenue and net value against the good hire shown above:

As you might expect, the great bulk of the cost of a bad hire is caused by the lost revenue. It’s bad enough that the bad hire underperforms; what’s even more damaging is that revenues are zero while you’re searching for the replacement, and they remain below-quota during the new rep’s breaking-in period.
You can also see that almost all of that lost revenue drops straight to the bottom line – the “savings” (if you want to call it that) from the lower commissions, and from not having to compensate anyone while searching for the replacement, are largely offset by the transition costs of replacement and breaking in a new sales rep.
So the next time you start wondering whether search fees are worth it, consider how much value a good search generates. And what a bad one will cost you. In a subsequent post, we’ll take a closer look at how probability and
This analysis really pops out when we’re looking at sales reps – it’s no wonder that headhunting for sales reps is such a booming business. But the above analysis can be modified to analyze ANY type of hire –
[p.s. If you’d like to do your own what-if gaming with your own assumptions, drop me a line – I’ll be happy to send you the
“Painting with Numbers” is my effort to get people to focus on making numbers understandable. I welcome your feedback and your favorite examples. And see more about my writing and “Painting with Numbers” at www.painting-with-numbers.com. I originally wrote this blog for 121 Silicon Valley, a high-tech search and advisory firm that focuses principally on executives in sales and in the C-suite. I’ve modified it somewhat here for a broader professional audience.

