This post is an extension of my blog post on Pricing, which is one of the key parts of P&L
To set the stage, let’s take a company that operates in a branded market, like FMCG or pharmaceuticals. The company focuses on differentiation of its products vs. competition and uses value-based pricing. We have already estimated the brand value, ‘weighed it’ against price, and set up metrics for its improvement using ComStrat from Simon-Kucher & Partners.
While ComStrat focuses on the external factors, namely on brand positioning vs. competition, we now further deepen the analysis and consider a complimentary tool to understand logic of pricing a product within the brand line-up. Simon-Kucher & Partners call it the ‘Price map’, while in Deloitte world it is known as ‘Attribute based pricing’. The basic idea is to find the product attributes that drive customer’s willingness to pay, and price the product accordingly.
To see this in action, we will go through four steps process and then demonstrate how this approach can be realized and reflected in a simplified Price map.
-
To begin, perform product categorization, by answering questions like
-
Does the product fulfill the corresponding consumer needs?
-
Does the product have a substitute?
-
Do the customers compare prices of these products?
Depending on the answers, products from the brand line-up can be divided into several categories. For example, products for adults and for kids will be placed into different categories because they generally are not substitutes, and their prices are rarely compared by the customer.
-
- Next, for each category category defined in Step 1, select attributes that influence customer willingness to pay. For a bar of chocolate, typical attributes would be weight/size, package type, cocoa content, some other ingredients. Interestingly enough, flavor is not a price differentiating attribute – chocolate bars with different taste from the same brand line-up often have the same price. For OTC (over-the-counter) drugs, typical attributes are strength, dosage, convenience/form, pack size and additional ingredients like vitamin C, or taste in kids products.
- Now, we are ready to develop pricing principles. Here, it is worth to start with a common sense, and prior experience in pricing comes in handy. For example, doubling weight/package should not automatically lead to doubling the price, but some discount should be applied. Typically, this discount is within a 10%-30% range, which can be your initial value for the corresponding principle. Having set up the initial values, then the principles should be validated by experience and best practices in the industry.
It also helps to check the distribution channel mark-ups for each product, either by directly assessing distributor and retailer pricing, or by getting average prices for end-consumer from industry statistics such as Nielsen or IMS and comparing it to own price lists. The shape of the distribution of these mark-ups indicates how the partners in trade perceive the value of the product. For example, we had a case where an average product mark-up of the trade partners was around 42%, while for the product with vitamin C it was more than 50%, which indicated that the company undervalued this attribute, and likely has a room to increase the price. Furthermore, this case served as a basis for developing a ‘vitamin C’ product pricing principle.
-
Finally, prepare two Price maps for each category: a current one, and an ideal one that has the identified pricing principles implemented. By adjusting the price to better match the end customer perception of value, the company would not only get more price-balanced product portfolio, but improves the bottom line, as the product mix is usually shifted in favor of more profitable SKUs.
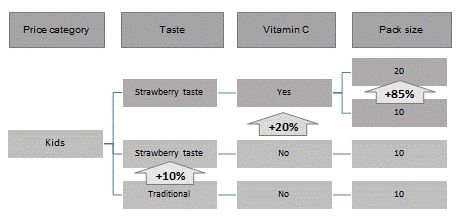
The following illustration walks through a process of portfolio building within a brand line-up for OTC drug based on identified value-based pricing principles, and then finds its reflection in a simplified Price map:
-
Historically, a company had one product for kids cough relief, with a bitter taste
-
A new product was launched with strawberry taste, at a 10% premium
-
Then another product with Vitamin C was added to portfolio, with another 20% premium
-
Finally, a new double pack was added, at a discount of 15% per tablet.

This set can be extended with additional attributes, and will result in a logical price-attribute map covering the whole brand line-up. Further building of the portfolio is based on the similar principles.
As a result of implementing such a concept, a company gets threefold benefit:
-
Build appropriate Price structure (from a customer perspective) of all products within the brand line-up
-
Identify gaps & inconsistencies in existing portfolio from a consumer’s point of view
-
Price new products in logical alignment with the existing portfolio.
Having positioned the brand relative to competition with the help of tools similar to ComStrat, a company can achieve a priced-balanced portfolio for each brand by applying the technique we considered in this article. Looking at the pricing through customers eyes efficiently unlocks improvement for both top and bottom lines, so it is recommended keeping this tool in your P&L management toolkit.

