Proformative Note: This is the final post in a 5-part series on P&L
Although profit is a bottom line of P&L, and an ultimate goal of most businesses, a company often seeks a balance between profit maximization, Sales (and/or Market Share) growth, and liquidity (including Net Working Capital optimization). For example, for Differentiation strategy and value-based pricing, it is recommended not to capture the whole value surplus against competition in the price, but rather share it with consumers (Simon, 2015). In this case, the higher price captured by the company contributes to its profit, while residual value surplus helps the customer choose in favor of company products (hence driving Sales). In the example about Ford Mustang, described above, it would mean that the company had a chance to raise the price by $500, having estimated $1 000 price delta with consumer perceived value.
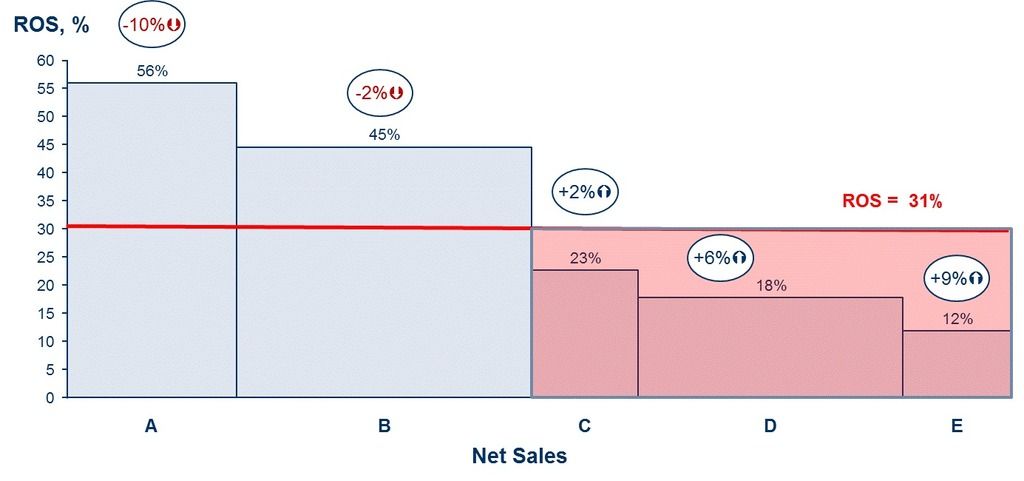
Profit, and especially Return on Sales (ROS) component, allows looking at the company performance from a somewhat unfamiliar side (as presented below), which helps make better strategic choices. This view presents Sales by product group on axis X, while ROS is shown on axis Y, which reveals contribution of each group of products to overall company profitability. Sales growth marker at the top of each bar adds insight into dynamics to the chart, and shows in what direction company profitability would move in the near future.

A regular journey along P&L, done in a systematic way like the one described above, offers managers new insights into the business. It also expands their arsenal with the new tools, and helps learn when and in what situation to use each tool. This ultimately allows the company to avoid icebergs, identify growth opportunities along the way and increases chances of success.
Bibliography
Iacocca, L., & Novak, W. J. (1986). Iacocca: An Autobiography. Bantam.
Porter, M. E. (1998). Competitive Advantage: Creating and Sustaining Superior Performance. Free Press.
Simon, H. (2015). Confessions of the Pricing Man. Springer.

